
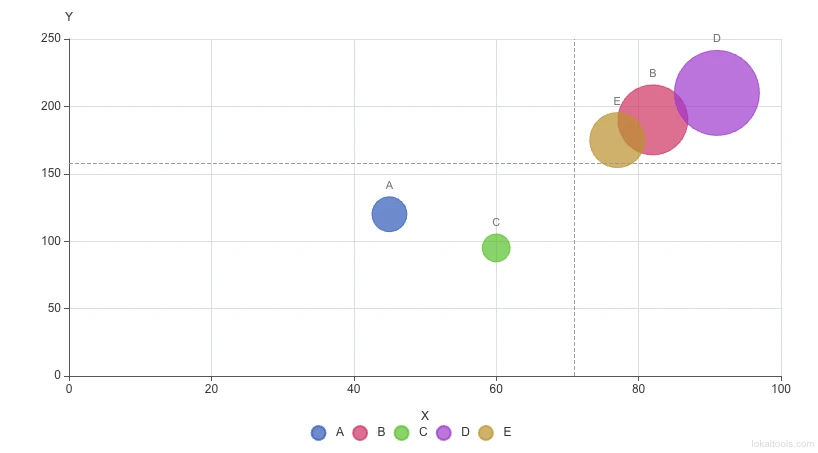
Bubble Chart
Plot X, Y, and bubble-size (Z) data points. Great for portfolio analysis and BCG matrices.
About Bubble Chart
Plot three variables simultaneously across X position, Y position, and bubble size. Ideal for portfolio analysis, BCG matrices, and magnitude comparisons. All processing is 100% client-side.
How to Use
- Paste your data — copy cells from Excel or Google Sheets. The tool auto-detects columns instantly.
- Map your columns — review the detected mapping for Label, X, Y, and Size (Z) and adjust via dropdowns.
- Adjust settings — use the panel to configure Titles, Legends, and Appearance with live previews.
- Toggle Quadrant Lines — enable average crosshairs to create a BCG-style growth-share matrix.
- Set brand colors — enter a hex code to generate a harmonious, professional color palette.
- Export — download as a high-res PNG or a native, editable Microsoft Chart object in PPTX.
Common Use Cases
- BCG Matrix Analysis — track market share vs growth to categorize product portfolios.
- Project Portfolio Management — plot projects by Risk, Return, and Resource Cost.
- Global Socioeconomic Data — compare countries by GDP, Life Expectancy, and Population.
- Employee Potential Mapping — visualize performance vs potential vs tenure in HR.
- Secure Finance Analytics — analyze sensitive client portfolios with zero data upload.
Technical Details
Powered by Apache ECharts for canvas rendering and pptxgenjs for native PowerPoint chart objects. Bubble size scaling uses square-root normalization for accurate magnitude representation.
Frequently Asked Questions
- What is represented by bubble size?
- The bubble size (Z-value) represents a third dimension of data, allowing you to compare magnitude alongside X and Y coordinates.
- Can I position the quadrants manually?
- Currently, quadrant lines are automatically positioned at the average X and Y values of your dataset.
- What data is a bubble chart best suited for?
- Bubble charts are ideal when you have three numeric dimensions per data point — for example, market segments with Revenue (X), Growth Rate (Y), and Market Share (bubble size). They are popular for portfolio analysis, competitive benchmarking, and product prioritization.
- How do I export my bubble chart to PowerPoint?
- Click 'Download PPTX' to get a native PowerPoint bubble chart object. Unlike an image export, the PPTX chart is fully editable: you can change axis labels, bubble sizes, and colors inside PowerPoint without redoing the chart.
- How should I format my data for a bubble chart?
- Prepare at least three numeric columns — one for the X axis, one for the Y axis, and one for bubble size — plus an optional label column. Paste this data from Excel or Google Sheets. All values in the size column must be positive; the tool scales them proportionally.
- Is there a limit on how many data points a bubble chart can display?
- The bubble chart handles hundreds of data points comfortably in the browser. Very large datasets (thousands of rows) may cause the chart to feel sluggish on older devices because each bubble is rendered as an SVG element. For large datasets, consider aggregating your data into meaningful groups before charting to keep the visualization readable — a chart with 50 labeled bubbles is usually more insightful than one with 5,000 unlabeled dots. All data stays in your browser and is never uploaded.
Chart Data in PNG — Resume Editing
What is embedded chart data?
PNG exports and shared links may include your original chart data and settings. Anyone with the file or complete link may recover them.
How to use it
- Export your chart to PNG
- Keep the PNG file
- Drop or paste it into the "Resume Chart from PNG" tool any time you need to edit it again
- Your chart restores exactly as you left it — make changes and export again
Why this is better than static images
Other chart tools export PNG images that are final — once exported, you cannot edit them without redoing the work from scratch.
- No need to save the source spreadsheet separately — the PNG IS your backup
- Share a PNG with a colleague and they can restore and edit it without the original data
- Years later, if you need to update a chart, open the PNG and resume — no searching for old files
- For archival: keep PNGs alongside your reports and presentations; they are fully self-contained
Is it secure?
PNG exports and shared links may include your original chart data and settings. Anyone with the file or complete link may recover them.
Embed URL — Interactive Chart for Presentations
What is the Embed URL?
The Embed URL opens a clean, interactive version of your chart in a browser — showing only the chart with no tool interface, no settings panel, and no export buttons. Tooltips and hover interactions work fully. The chart data is encrypted in the URL, just like the Recovery Link.
Where to find it
- Click the "🔗 Embed URL" button on the chart tool page — it copies the URL to your clipboard instantly
- The embed URL is also saved below the slide boundary in your exported PPTX file, labeled "Embed URL — interactive view"
Using the Embed URL in Other Tools
The Embed URL works anywhere that supports iframes or URL embeds:
- Notion — paste the URL as an embed block (type /embed in Notion)
- Confluence — use the HTML macro or iframe macro with the embed URL
- SharePoint — embed via the Embed web part
Any website or intranet page — use a standard HTML iframe:
<iframe
  src="YOUR_EMBED_URL"
  width="800"
  height="500"
  frameborder="0"
  allowfullscreen>
</iframe>
Note on self-hosted deployments: If your organisation uses the self-hosted version of Lokaltools on your intranet, embed URLs point to your internal domain. These will only work for viewers on your company network or VPN — which may be exactly what your IT security team requires.
Chart Colors — Brand-Consistent Palettes in Seconds
Most charting tools give you a fixed color palette you cannot change, or require you to manually pick every color one by one. Lokaltools uses a three-step color system that starts from your company's brand color and builds a complete, harmonious palette automatically.
Step 1 — Brand Anchor
Enter your company's primary brand color as a hex code (e.g. #0066CC) in the Brand Anchor field. This is typically your main logo color, primary button color, or the dominant color from your brand guidelines. The brand anchor color is used as the starting point for all palette generation. Every color in your chart traces back to this single input — so your chart always feels on-brand without manual color selection.
Step 2 — Harmony
The Harmony dropdown selects the color theory rule used to generate the remaining chart colors from your brand anchor. Each harmony produces a different relationship between colors.
| Harmony | What it produces | Best for |
|---|---|---|
| Analogous | Colors adjacent on the color wheel — subtle, cohesive | Single-theme data, when colors should feel similar |
| Complementary | Two colors directly opposite — high contrast | Two-series comparisons, positive vs negative |
| Triadic (Balanced) | Three evenly spaced colors — vivid but balanced | Most business charts, 3-6 data series |
| Split Complementary | One anchor + two colors flanking its complement | Good contrast without full complementary tension |
| Tetradic | Four colors forming a rectangle on the wheel — rich | Charts with 4+ series needing maximum distinction |
Triadic (Balanced) is the default and works well for most business presentations. Switch to Analogous for a more subtle, conservative look, or Complementary when you want two data series to visually contrast strongly (e.g. budget vs actual).
Step 3 — Generated Swatches (Manual Override)
Below the harmony selector, the tool displays 5–6 generated color swatches — these are the actual colors that will appear on your chart. If any individual color does not work, click that swatch to open a color picker and replace it with any color you choose. Manual overrides are preserved in the recovery link.
Background mode (Light / Dark toggle): switches the palette lightness to suit your slide background. This adjusts the generated colors automatically so they remain readable.
Tips for Brand Color Usage
- Finding your exact brand hex code: Check your company's brand guidelines PDF, or right-click your company logo on the website → Inspect → find the CSS color value.
- When to use Analogous vs Triadic: Use Analogous when your chart has one dominant message and you want colors to feel unified. Use Triadic when each series represents a genuinely different thing (e.g. Revenue, Cost, Profit).
- Matching exported chart colors to your PowerPoint template: The PPTX Exact export preserves colors pixel-perfectly — what you see in the browser is exactly what appears in your PowerPoint slide.
Frequently Asked Questions
- Does this tool work offline?
- Yes — once the page has loaded, the tool works fully without an internet connection. The only exception is the Embed URL interactive view, which requires the chart tool page to be reachable when the embed is displayed.
- Can I use this for confidential or sensitive data?
- Yes. Your data is processed entirely in your browser using WebAssembly. It is never sent to Lokaltools servers or any third party. This makes the tool suitable for financial data, patient data, legal documents, and any other sensitive information.
- What data formats can I paste?
- Copy cells directly from Excel, Google Sheets, or Apple Numbers and paste — the tool auto-detects the format. CSV file upload is also supported. Data copied from web pages or PDFs may not paste correctly — clean it in Excel first.
- How do I find my company's brand hex color?
- Check your company's brand guidelines document or open your company website, right-click the logo or a branded button, select "Inspect", and look for a CSS color value starting with #.
- Can I save my brand color so I don't have to re-enter it every time?
- The brand anchor color is saved in the Recovery Link along with all other chart settings. Export your chart, then use the Recovery Link next time to restore your brand color automatically.
- Is the embedded chart data permanent?
- Yes. The embedded data is stored in the PNG file itself — not on any server — so there is no expiry. As long as you have the PNG file, you can restore and edit your chart.
- Can I share the PNG with a colleague?
- Yes — anyone with the PNG file can restore and edit the chart using the "Resume Chart from PNG" tool. Treat the PNG like a shared document: share only with people who should have access to the underlying data.
- What is the difference between embedded PNG data and Embed URL?
- Embedded PNG data contains your full chart state encrypted in the PNG file — you can drop it into the "Resume Chart from PNG" tool to edit and re-export. The Embed URL opens a view-only interactive chart with no editing capability.
Privacy & Security
This tool runs entirely in your browser. Your data follows this path: Your spreadsheet → Your browser → Your exported file. Nothing else. No upload step. No server processing. No analytics on your data content.
Chart PNG exports may contain the original chart data and settings as recoverable metadata. Recovery and embed links contain data and the key needed to open it in the URL fragment. Anyone with the file or complete link may recover that data. Share only with intended recipients. A fragment is normally omitted from HTTP requests, but JavaScript and services you share a link with can read it.
For organisations requiring formal confirmation: Lokaltools cannot read your data, does not store your data, and has no technical mechanism to access your data even if legally compelled to do so. This is not a policy — it is an architectural fact.
Technical Details
Powered by Apache ECharts for high-performance canvas rendering, PapaParse for intelligent CSV and tab-separated data parsing, and PptxGenJS for native OOXML chart objects. Magic link encryption uses the browser's built-in Web Crypto API (AES-256-GCM) with pako compression — no external encryption library required. All processing is 100% client-side. No data is transmitted at any point.
Local processing
Our local file, text and chart tools process content on your device using JavaScript, browser APIs and, where needed, WebAssembly. Our usage events do not include filenames, file contents, input text, chart values, raw errors, emails or license references. Network lookup tools (such as DNS, WHOIS, IP and speed tests) contact external services for their stated purpose. Loading the website, fonts, libraries and models also makes network requests. WebAssembly itself does not prevent network access.